


Market at All Time Highs
As markets rise higher and higher, so too does investor anxiety. The bears are anxious due to their belief this rally is all hype and doomed to fail, and the bulls are anxious from FOMO (fear of missing out).
The financial media has tended to focus on the aging market rally and the geopolitical threats which play into the anxiety (if not outright stoke it). It should be noted that they have been calling an end to the rally since it began back in march of 2009. In fact, this rally has been dubbed the “most hated market really” because it has repeatedly defied forecasts of impending doom. Indeed, it has climbed what Michael Batnick calls the wall of worry (see below).
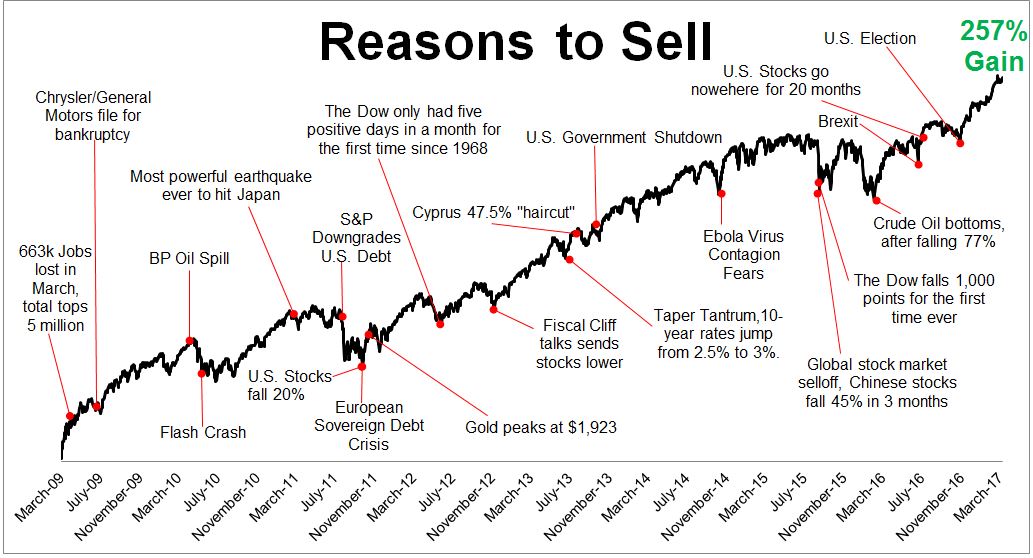
You can see from the chart above, it pays to stay focused on the long term.
Bill Gates nicely summed up why the media tends to lead with the bad news and seemingly ignore the good…
“Headlines, in a way, are what mislead you because bad news is a headline and gradual improvement is not.”
The very term “all time high” can bring about anxiety, especially when the media makes absolute sure you don’t miss the headline. It seems to produce a “never been here before” feeling out our gut. The reality is, all time highs happen all around us and are a natural byproduct of a growing population.
It’s also important to be aware that new highs, as measured by round numbers in the DOW, will happen more and more frequently. In the 80’s when the down was at 1,000. It took a 100% increase before it hit 2,000. Today, it only takes a 4% movement to go from DOW 25,000 to 26,000. As it takes smaller percentage gains to hit these round numbers, you can expect to hear about them more frequently. So even though they sound historic, the pure numbers don’t carry the same meaning they once did.
Remember, stay focused on the long term. Watching the daily market gyrations and paying attention to the headlines reminds me of this Alan Abelson quote:
“Do you know what investing for the long run but listening to market news everyday is like? It’s like a man walking up a big hill with a yo-yo and keeping his eyes fixed on the yo-yo instead of the hill.”
Here is one more chart to put long-term market growth in perspective.
Simple rules for the chart above:
1 – Blue is an image of bull market lengths and height of returns.
2 – Orange is for bear market lengths and depths of losses.
3 – Stare at how much blue there has been since 1926
4 – Stare at how much orange there has been since 1926
5 – Ask this question: “Why in the he$$ am I always worrying about the orange?”
…end of lesson.
This isn’t to say we expect markets to be smooth sailing from here. Absolutely not. In fact, one of the things we tell clients we can guarantee is that there will be market crisis in the future, and periodically throughout the years. When they come, they will feel as though the wind was knocked out of you. They are scary. But they do pass.
Indices are not available for direct investment. Their performance does not reflect the expenses associated with the management of an actual portfolio. Past performance is not a guarantee of future results. Diversification does not eliminate the risk of market loss.
There is no guarantee investment strategies will be successful. Investing involves risks including possible loss of principal. Investors should talk to their financial advisor prior to making any investment decision. There is always the risk that an investor may lose money. A long-term investment approach cannot guarantee a profit.
All expressions of opinion are subject to change. This article is distributed for informational purposes, and it is not to be construed as an offer, solicitation, recommendation, or endorsement of any particular security, products, or services. Investors should talk to their financial advisor prior to making any investment decision.